Hole strategy
How the hole plays, before you play it
Open Hole strategy from the round menu and see how the golfers before you did: the field average, how hard the hole is, where the fairway misses go and a heat map of where tee shots finish. Your own numbers sit next to theirs.
Get Chalk for iPhone ↗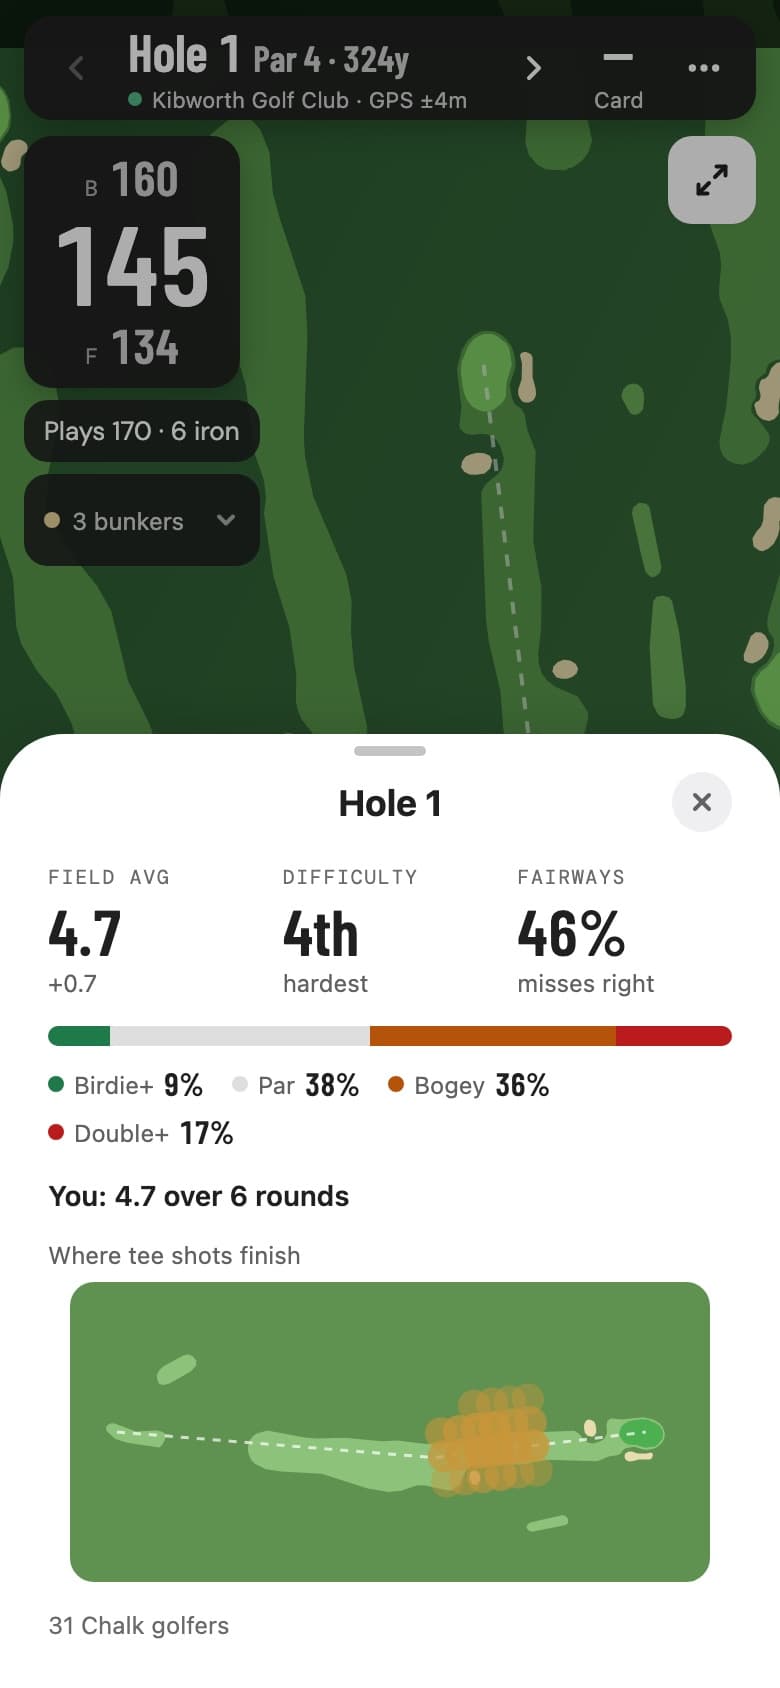
What the sheet shows
- Field average
- The average score on the hole and how far over par it is, from every Chalk golfer who's played it
- Difficulty
- Where the hole ranks against the rest of the course, by score against par
- Score mix
- How many make birdie or better, par, bogey, and double or worse
- Fairways
- The fairway hit rate and the side most of the misses go
- Where tee shots finish
- A heat map of landing spots on par 4s and 5s, from marked shots
- You
- Your own average on the hole over the rounds you've played it
A hole that plays 0.7 over par for everyone, with 46% of fairways hit and the misses right, tells you something a yardage never will: aim left, take bogey if it comes, and don't chase it. The heat map shows where a good drive actually finishes rather than where the hole diagram says it should.
The whole course, hole by hole
The course stats page lists your toughest and easiest holes, then every hole with your average, your best, your putts and the field's numbers alongside. Tap a hole to open it up.
More on Stats →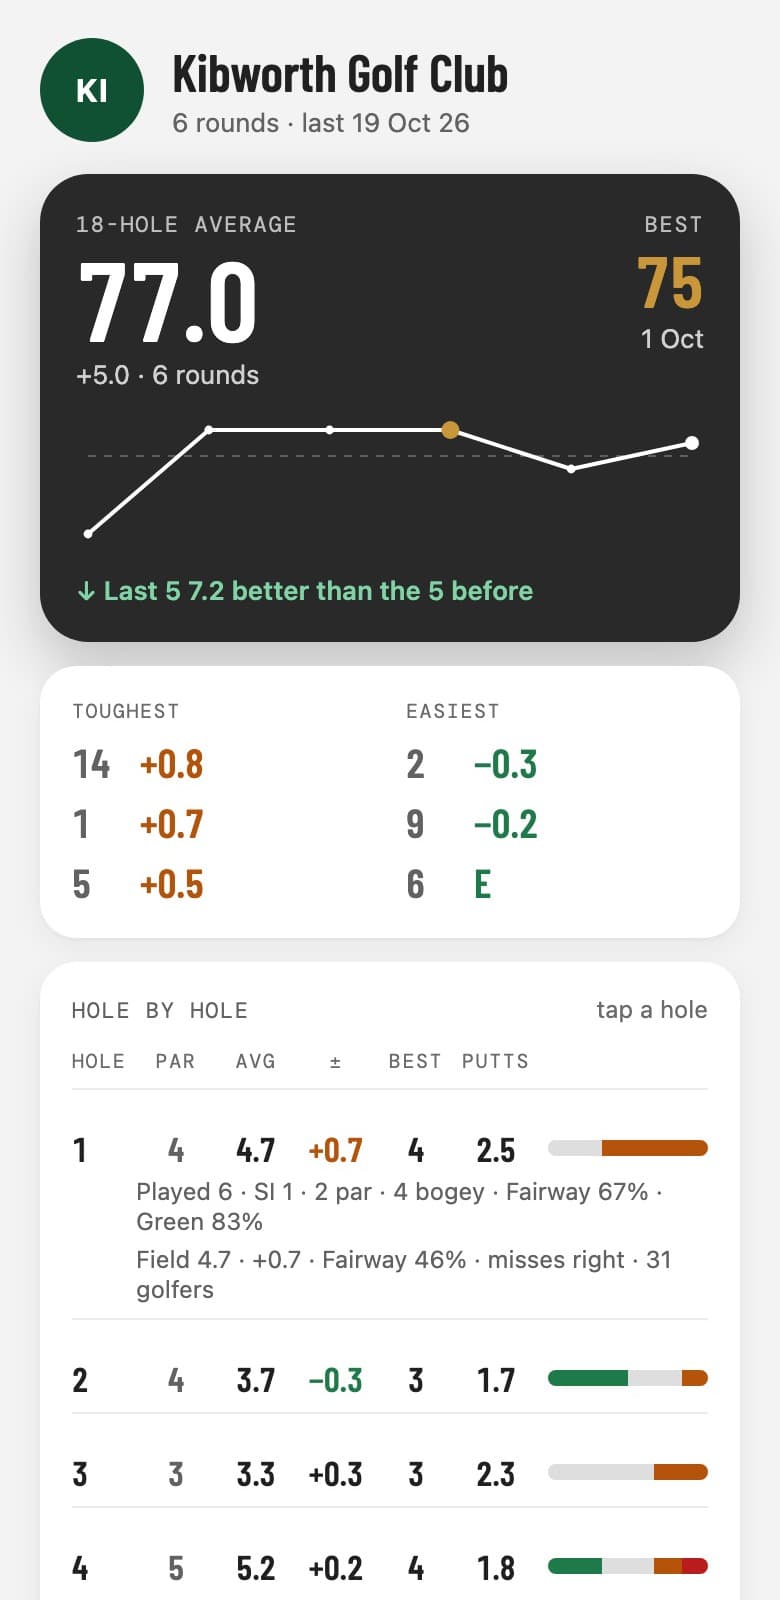
With the shot in front of you
- Plays-like. Under the yardage: what the shot plays with the slope, wind and air counted, and a club from your bag. How plays-like works.
- A tip. One line over the map for the conditions: into the wind, more club and an easier swing; downhill, land it short; wet, expect less run.
- Mark the shot. Tap Mark where you stand and Chalk keeps the lie, the distance and the club, which is where your club distances and strokes gained come from, and where the heat map gets its dots.
Private by design
Nothing shows on a hole until five golfers have played it. Drives come back only as cells about 15 metres across that three or more golfers share, never as a single point, so no one can pick out your round. Golfers with “Don't share my golf” on, and rounds hidden from the feed, are left out. Only GPS marks count as landing spots; voice notes are left out because they record where you spoke.
Questions
Where does the data come from?
From rounds scored in Chalk on that course. Scores give the field average, the mix and the difficulty. The fairway hit rate and the miss side come from the tee shot each golfer records, and the heat map comes from shots marked with GPS.
Which courses and holes have it?
A hole shows the field numbers once five Chalk golfers have played it, so it fills in as people play. Your own hole stats are there from your first round.
Can other golfers see where my shots went?
Not as single points. Drives only appear in the heat map as cells about 15 metres across that three or more golfers share. Turn on "Don't share my golf" and your rounds are left out entirely, and rounds hidden from your feed are left out too. Voice notes are never used, because they record where you spoke, not where the ball was.
Is it allowed in a competition?
Looking at how a hole has played for other people is information, like a yardage book, and Rule 4.3 doesn't restrict it. What the Rules do restrict during a round is measuring elevation and a device recommending a club, which is why Chalk's Competition mode hides the plays-like number, the club pick and the tips.
Is hole strategy part of Pro?
Yes. Hole strategy, the field's numbers on the course stats page, plays-like distances and the tips are Pro. Your own per-hole stats on every course you've played are free.
Does it work on Android?
Yes. Hole strategy and course stats are the same on Android and iPhone.
Related
Field numbers come from rounds scored in Chalk and change as more golfers play the hole. They are not official course statistics.